#
Top down – US Venture
This lower-bound (conservative) model estimates that the average Grove network participants can expect to earn $23,000 - $35,000 per year from the network. We do this by creating a proxy of Grove Network net asset value (NAV) from publicly available venture industry data. At any given time, there are a little over 50,000 VC backed startups in the United States,{^1} this number has been steadily increasing for decades along with the general growth of venture capital as an industry.{^2} Of these, we know:
- As of January 1st, 2024 & according to data from Crunchbase,{^3} there are 732 unicorns in the United States
- The aggregate value of these unicorns is $2.299 trillion
- There are an additional 184 emerging unicorns (startups valued between $500 million and $1 billion), with an aggregate value of $123 billion
- There are an average of 1.85 founders per startup, which means roughly 1.85 * 50,000 = 92,500 founders in the USA
This means that across ~50,000 VC-backed companies, some 916 (<2%) have generated $2.42 trillion in value. Comparing this number to PitchBook’s data on all VC-backed startups in the USA having a combined equity value of $2.9 to $3.7 trillion {^4}, it’s immediately obvious that VC returns are far more concentrated than a typical 80 / 20 Pareto distribution {^5} – where 20% of inputs create 80% of outputs – and is closer to 95 / 5. Turning to Grove economics, we assume that whatever market penetration Grove achieves – regardless of whether it’s 0.1%, 5%, or 95% – Grove network participants are reflective of the average USA VC startup landscape. This means the per-founder economics of the entire USA venture system will broadly reflect the per-user economics the Grove network. To find out the per founder economics of a grove-like network across the entirety of US venture, we must first estimate NAV per network participant. This is done using the below formula:
- NAV per network participant = (total value of startups * percentage founder owned * avg number of founders per company * percentage pledged){^6} / (Total number of founders * 1/performing percentage){^7}
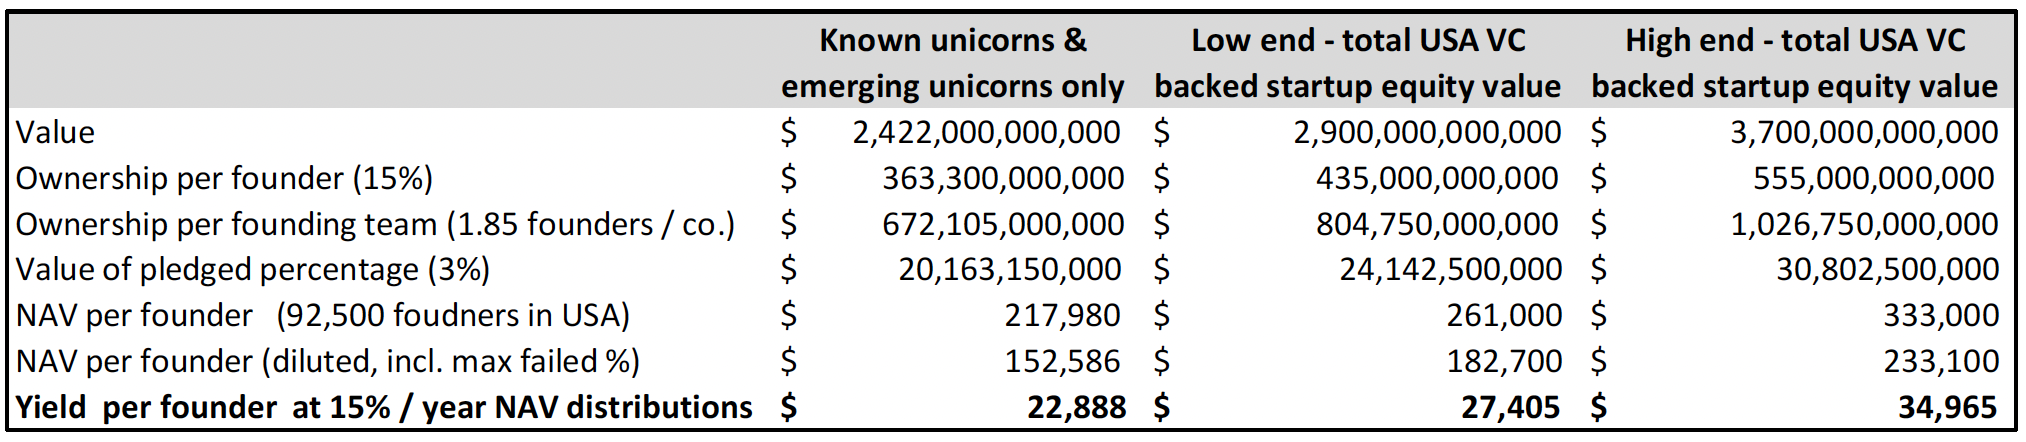
In the table above, we see the progression of this formula along with underlying assumptions, across the three possible metrics for total startup value in the US, in order from most conservative (only considering unicorns & emerging unicorns) to least (the high end of the PitchBook estimate).
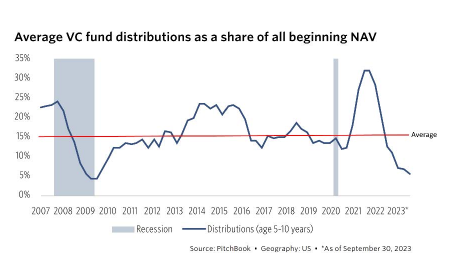
It is worth repeating that this is cash yield per network participant. This means that regardless of the market penetration achieved by Grove the per network participant metrics remain the same so long as Grove’s network is broadly representative of the VC startup landscape in general. Notwithstanding, because of the entry criteria & exit queue mechanism, we expect the Grove network to outperform the yields in this methodology.
Footnotes
- Persaud, Vishal. “Startup extinction season is going to kick into high gear — and there's likely going to be a bloodbath soon for some of the 50,000 VC-backed startups.” Business Insider, August 26, 2023
- National Venture Capital Association 2023 Yearbook
- The Crunchbase Unicorn Board, https://news.crunchbase.com/unicorn-company-list/, data current on 01/01/2024
- Thorne, James. “Private Markets are Bigger Than You Think,” PitchBook, October 2, 2022
- A resource to understand Pareto distributions: https://corporatefinanceinstitute.com/resources/economics/pareto-distribution/
- The numerator reflects the total value of founder-owned equity pledged to the Grove network
- The denominator reflects the total number of founders in the Grove network. Since we are using the entire US, this total is 50,000, with an adjustment to reflect the max 30% of the network that will be non-performing
- 2024 US Venture Capital Outlook, PitchBook