#Top Down – Y Combinator

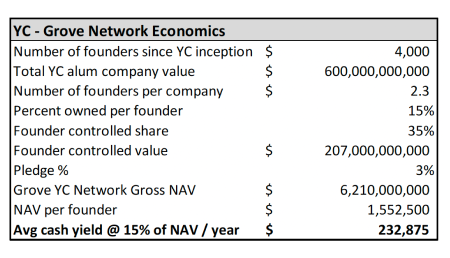
For this, we turn to Y Combinator & use a similar methodology. As summarized in the table at right, the 4,000 companies who’ve gone through the YC program have generated an aggregate of ~$600bn in value , and represent over 9,000 founders (on average, 2.3 per company).
Given average per-founder ownership of their startups of 15% at the time of exit and our average Grove pledge amount of 3% of future liquidity, these metrics flow through to yield an average NAV per YC founder, since inception, of ~$1.55 million, or average cash yields from network participation of ~$230k / year.
Of the $600bn in value created by YC, roughly half was created by their top 5 performing companies (Stripe, Coinbase, Airbnb, Dropbox, DoorDash). Put another way: we once again witness a massive concentration of returns coming from an extraordinarily small number of top performing companies: in this case, 0.125% of companies generating just shy of 50% of network returns. The lower performing 75% of YC network companies generate 0 or near 0 of the value.
It’s important to note that YC’s math is inflated. For example, YC calculates their network-created value of $600bn by taking the highest valuation at different points in time for different companies. They are not using the value of when YC exited, or even when the founders exited. In other words, the reality is that the cash yield would be materially lower than $230k per year or $1.5M NAV if our methodology with YC were truly apples-to-apples with our “whole US venture” methodology, which uses startup valuations as at January 1, 2024.
Nevertheless, the network unit economics are compelling. A few notes:
- As presently structured, the median YC founder sees their shares in their YC-backed startup go to zero and never sees a dollar from exiting / selling / IPO-ing their startup or the YC network
- Notoriously, albeit anecdotally from interviews with YC founders, the best performing YC backed companies in the long term are not those companies which were “hottest” upon the completion of the YC accelerator & their post demo-day fundraising
The bottom line is that for founders who fail, receiving $230,000 in annual distributions or anywhere near it is life changing. Further, this top-down model does not factor in the exit queue mechanism, which would ensure that founders who shut down their startups shortly after ending Y Combinator receive some funds but are eventually removed from the network, to the benefit of all builders who continue working on their companies.
Footnotes
- https://www.ycombinator.com/
- Chang, Emily. Tan, Gary. ”Inside Silicon Valley’s Famous Startup School,” Bloomberg Technology Podcast, August 11th, 2023
- Note that the average number of founders per YC company of 2.3 is higher than the average number of founders per company in US venture at large of 1.85
- Using the same assumption as the Whole USA Venture model that distributions are around 15% of network NAV
- The Definitive YC Company List | YCDB - The Y Combinator Database